About This Report
In Holland, we believe that in order to become a vibrant, world-class community we must look at all aspects of our community. This includes the economic, social, and environmental impacts we all have. Our City of Holland Sustainability Committee has created a seven-pillar framework with “lenses” to help us evaluate and make more sustainable choices. We have used this framework model as a way to share information about our journey to become a more sustainable community. As the city’s vision statement says, Holland is “a vibrant, world-class community in a beautiful lakefront environment where people work together, celebrate community, and realize dreams.” We truly believe Holland is a great place to live, work, and play and we are working hard to ensure this is true for generations to come.
Within this document you will find metrics that follow along with the framework:
Awards | Smart Energy | Economic Development | Transportation | Community & Neighborhood | Quality of Life | Community Knowledge | Environmental Action & Awareness
While we understand there are many metrics we could use to report on sustainability in our community, these were selected to help us continue this conversation. Please use this document to help you understand this broad topic of sustainability and how it can be applied to your business or personal life. Then we encourage you to join our efforts in making Holland a vibrant, world-class community for all!
Our vision is a healthy and economically vibrant community that promotes environmental stewardship and mutual respect for people and the planet.
Our mission is to foster collaborative efforts to infuse sustainability into the minds and practices of the greater Holland community.
Awards
2020 Tree City USA by the Arbor Day Foundation
Hope College’s Campus Ministries Building Receives LEED V4 Certified
Hope College receives STAR Silver Rating
Cities with Nature Pioneer Community
Holland recognized by Insurify as “Greenest City in Michigan”
Holland Board of Public Works Receives Diamond Reliable Public Power – RP4
The American Society of Civil Engineers selected Holland Energy Park to receive the 2019 Innovation in Sustainable Engineering Award
Four city buildings earned the ENERGY STAR Certification from the U.S. EPA. The buildings include City Hall, Police Department, Transportation Services, and the Parks & Cemetery Office Building
Holland Named one The Best Beach Towns To Live In
America’s Best Cities For Global Trade
Best Small City to Start a Business
2019 was Holland’s first year participating in the MiGreenCommunities Program and received Gold Recognition
Bike Holland and the Boys and Girls Club of Holland Projects were both Recognized by Michigan Department of Environment, Great Lakes, and Energy (EGLE)’s Neighborhood Environmental Partners (NEP) 2019 Program
Lakeshore Advantage Annual Visionary Award
West Coast Chamber recognized as the “Michigan Outstanding Chamber of Commerce” award from the Michigan Association of Chamber of Commerce Professionals (MACP)
1/7
Smart Energy
Our way of living requires a stream of energy to operate personal and infrastructure devices. We know that energy is produced with scarce resources and the byproducts impact our environment. We need to use both conservation and efficiency measures to manage the resources we have to provide access to reliable and cost effective energy.
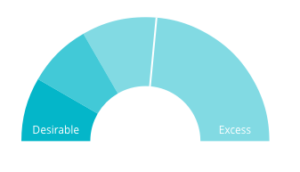
Electrical Makeup in 2019
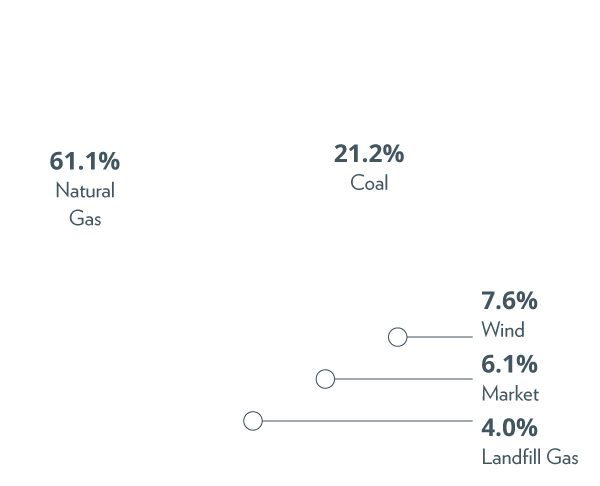
Source: HBPW
Holland Energy Fund
$1 million
in loans through the On-Bill Loan Program, which allows city homeowners to pay for energy improvements.
Source
Energy Labels (2018)
74
Homes with Deep Energy Retrofit. $19,240 average project cost. $1,423,760 invested in Energy Conservation and Home Improvements.
30.3%
Approximate reduction in air leakage, a 5% to 25% savings for kWh and Therms.
206
Total projects through the end of Fiscal Year 2019.
1,170
Total efficiency measures installed from 2016-2019. Air Sealing: 200; Appliances: 70; Building Envelope: 600; HVAC: 200; Non-Energy: 100.
Source
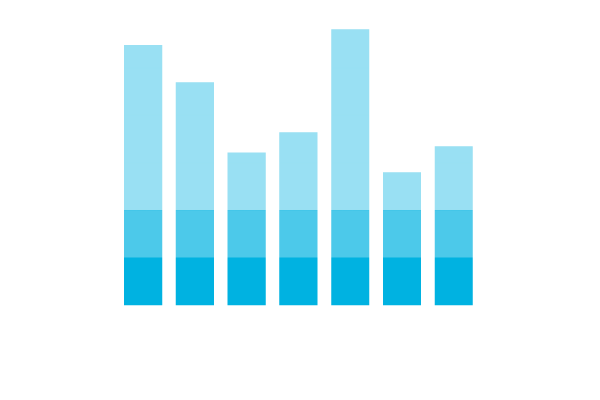
Holland Board of Public Works Kilowatt Hours SAVED THROUGH EFFICIENCY PROGRAMS IN 2019 (Residential and Business Sectors)
10,449,063
The equivalent of what more than 1,400 homes use per year.
18,731,099 (2017); 13,235,004 (2016); 12,865,357 (2015); 10,885,024 (2014)
Source: HBPW
avg savings 2014
$17.60 saved on average per household vs 2013 for electric service.
avg savings 2015
$14.63 saved on average per household vs 2014 for electric service.
Energy Star® Certified buildings in Holland
4
![]()
Source: City of Holland
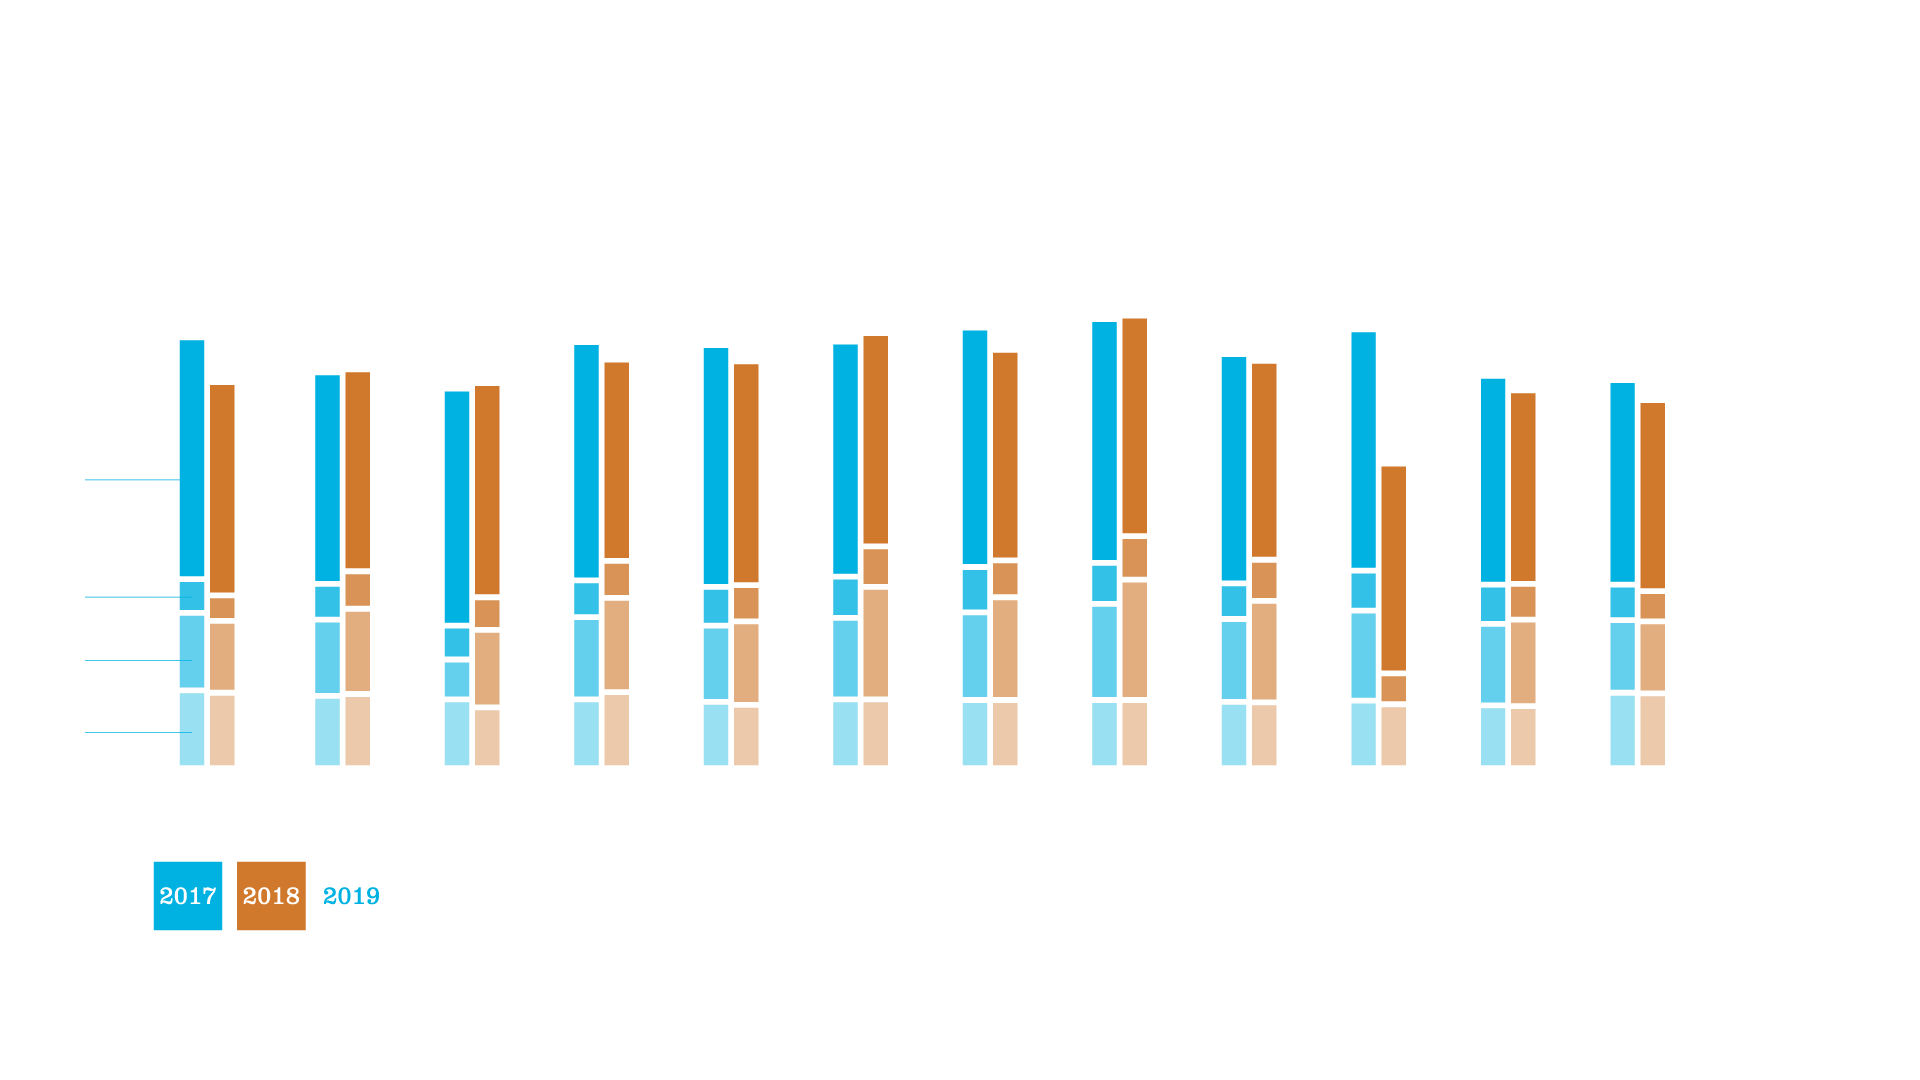
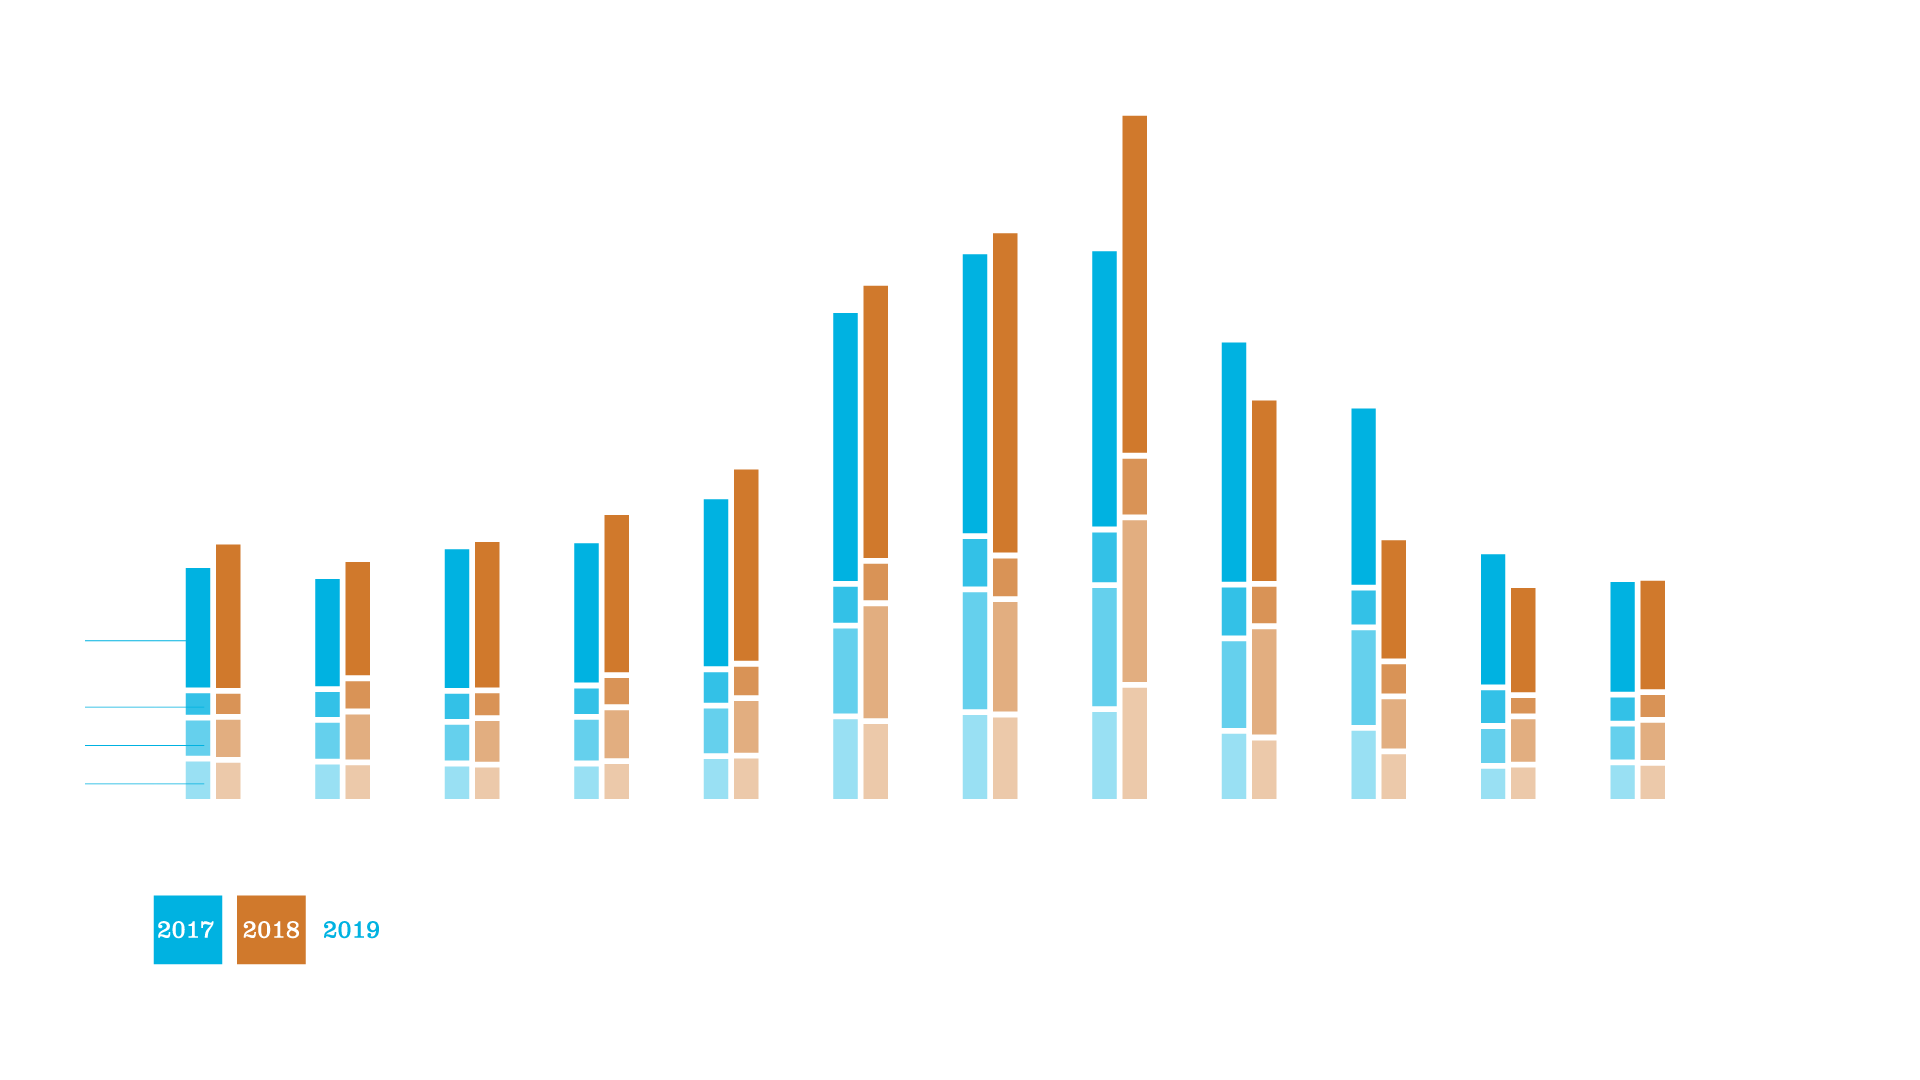
Electrical Usage (kWh)
2/7
Economic Development
The business community is the driving engine within the area. While it is dependent on community resources and structure for support, it generates capital essential to growth and development. We want to be a location of choice for new businesses and industry.
Housing market
Source: City of Holland Municipal Performance Dashboard
Median Household Income (2017)

$50,528 (2016); $46,424 (2015); $44,619 (2014); $43,532 (2013)
Source
Holland Unemployment Rate (2018)
3.8%
3.9% (2017); 3.7% (2016); 4% (2015); 5.4% (2014)
Source
Local First
![]()
Communities thrive when neighbors buy from locally-owned businesses, those businesses invest in their neighbors as customers and employees, and everyone develops sustainable lifestyles that engage and enhance their physical environment.
Source
Lakeshore Advantage
![]()
For more information on the West Michigan Lakeshore Region Economic Update for Allegan and Ottawa Counties, please click here.
Additional resources:
Definition of the Economic Indicators
Business Intelligence Page
Economic Indicators and Comparative Communities
Labor Market Info
Income
Source
$55,769
Median household income (in 2018 dollars), 2014-2018
$25,536
Per capita income in past 12 months (in 2018 dollars), 2014-2018
13.2%
Percent of persons in poverty
Source
households that meet or exceed the living wage standard for holland (2015)
63%
64.6% (2014) | 60.1% (2013)
businesses in holland (2016)
2,279
Holland has been recognized as the top small city to start a business in by Wallet Hub.
Source
The Lakeshore Advantage reports $367 million in private investment, creating 1,916 jobs.
2,304 (2015)
Source
Fastest Growing Counties in Michigan (2010-2018 growth rate)
#1 – Ottawa County (10.1%)
#7 – Allegan County (5.3%)
Source
Tulip Time Economic Impact Study (2018)
$74,822,108
The total economic impact of tourism to the Tulip Time Festival.
Source
Michigan West Coast Chamber of Commerce

1,200 member businesses
Source
Annual Report
Source
Holland recognized as the top small city to start a business in by Wallet Hub
Source
3/7
Transportation
The movement of people, goods, and services within the area is an evolving system. We interact with other regional, national and international elements to create a total network. The City of Holland will have a safe, connected transportation system that serves multiple modes.
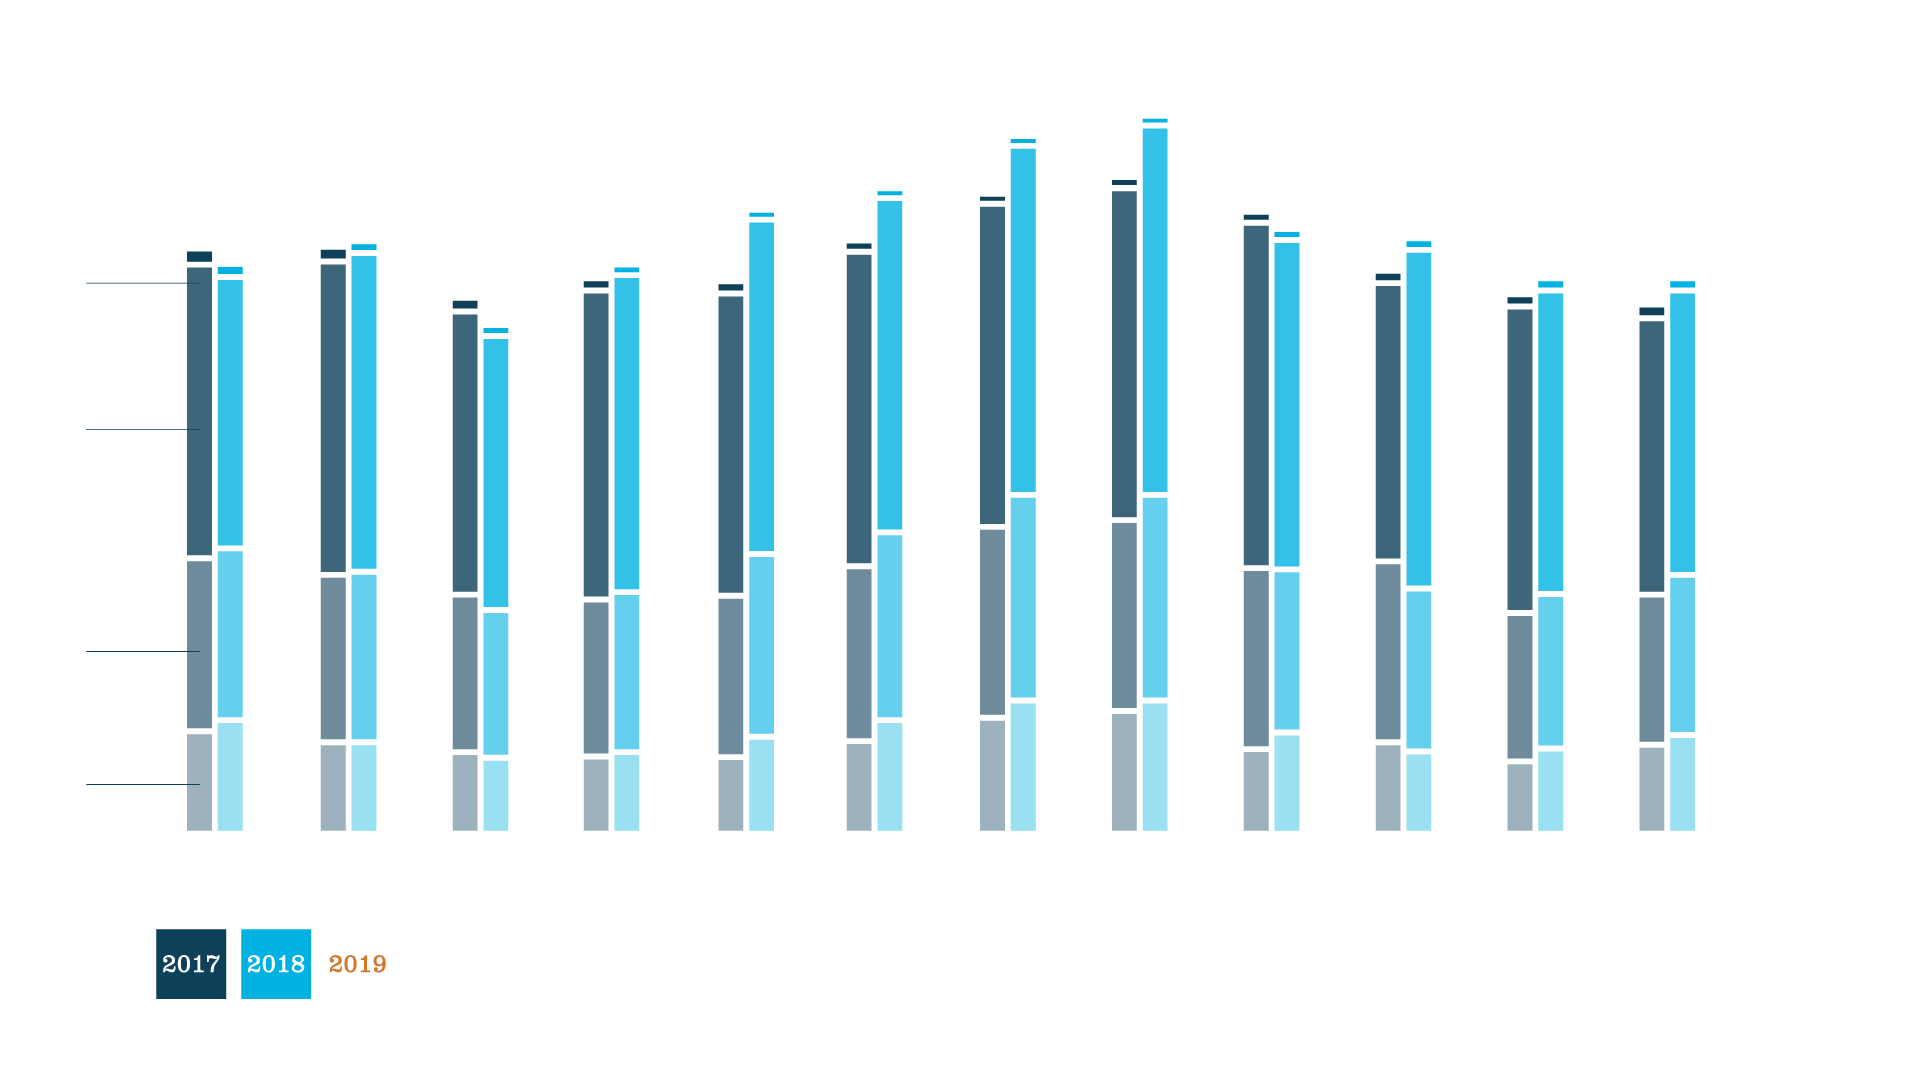
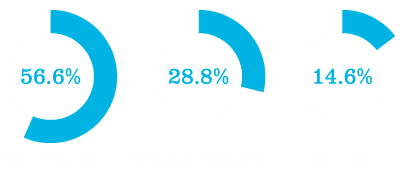
Commuters in Holland by Mode of Transportation (2017)
![]()
Source: STAR data
# of public car charging stations
Sixteen
![]()
City of Holland Car Charging Locations
Current Snowmelt Coverage
5+ miles
190 miles of tubing laid underneath the pavement and sidewalks and cover approximately 600,000 square-feet of heated sidewalks and streets.
City of Holland Snowmelt Information and Maps
“This town’s heated sidewalks make it a winter running paradise.”
– Runner’s World
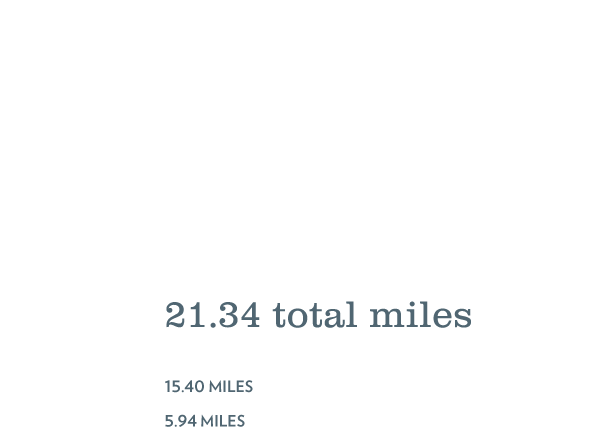
Green Commute (2019)
20,623 miles
of green commuting
18,368 pounds
of CO2 saved
$1,443
in fuel savings
Totals over the last twelve years: 107,821 miles of green commuting; 90,338 pounds of CO2 saved; $11,943 in fuel savings.
Source
increase in infrastructure over the past decade
22%
boardwalks
3%
bike paths
100%
bike lanes
infrastructure across the city
Although we have a historic grid pattern with 150 miles of streets and 365 lane miles, our 150 miles of sidewalk were recently supplemented by over eight miles of boardwalks, bike paths, and bike lanes (22%, 3%, and 100% increases respectively over the last decade). The historic street grid pattern allows residents to be well-connected and safe, especially when supplemented with bike trails and lanes.
The City is a partner with a full-service mass transit transportation agency (MAX) that serves 62% of the 100 square mile region with fixed routes and on-demand services.
For more information about Transportation, view the 2016 Annual Report
Macatawa Area Coordinating Council’s Transportation Page
bicycle and pedestrian fatalities in the city of Holland (2019)
Zero
Source: Holland Police Department
Holland’s Bike Network (as of Summer 2020)
The City also boasts a robust pedestrian network and quiet residential streets that act as comfortable extensions of the dedicated bike network.
Source: Bike Holland
Bike the Lakeshore PDF
4/7
Community & Neighborhood
The fiber of our lives can be traced to the places we live and the individuals we interact with on a daily basis. The places we live support the development of our personalities and perspectives on life. Communities at all scales have a vital role to play. Encouraging vital and effective communities is an important element.
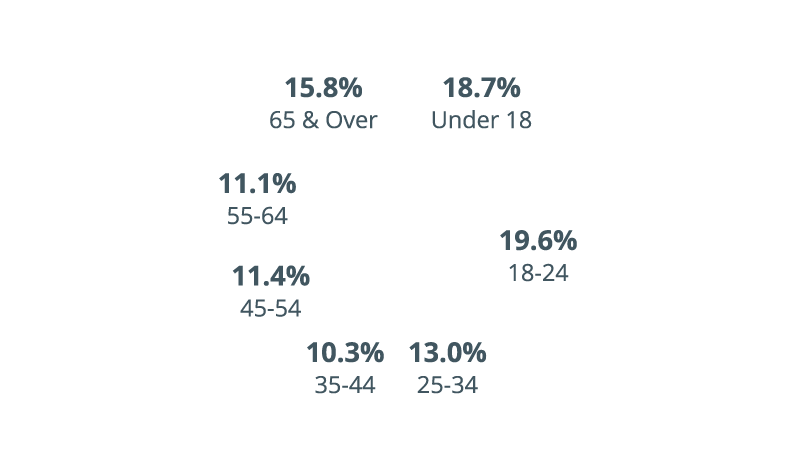
Population by Age (2018)
Source
Population
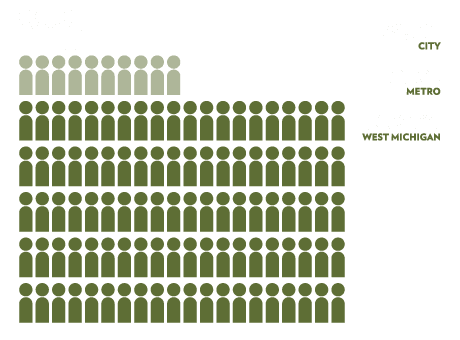
Source: US Census Bureau
United Way’s Community Assessment

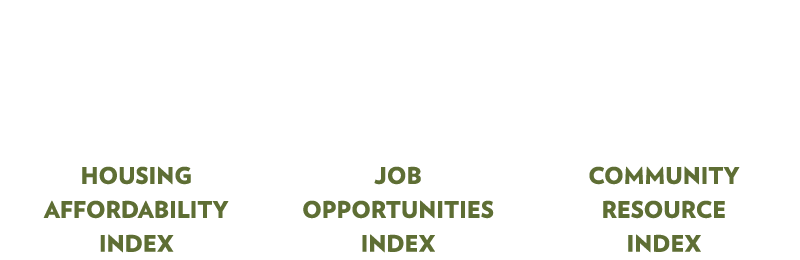
Housing afforability index: The key indicators are affordable housing gap + housing burden + real estate taxes. The score for Ottawa County is 67, with a state high of 76 and a state low of 45.
Job opportunities index: The key indicators are income distribution + unemployment rate + new hire wages. The score for Ottawa County is 78, with a state high of 85 and a state low of 38.
Community resource index: Thie key indicators are education resources + health resources + social capital. The score for Ottawa County is 50, with a state high of 79 and a state low of 38.
According to the 2018 Greater Ottawa County United Way’s Community Assessment “there are many people who continue to struggle to make ends meet. This situation can continue to be best captured by the latest ALICE figure showing 28% of households falling into this category, with an additional 8% living in poverty. That is just over one third of Ottawa County households falling into the ALICE or poverty category. The ALICE population represents those households in Ottawa County that are living in Ottawa County and working but can’t really afford to be living here. It is often through the supports of nonprofits, government agencies, faith-based organizations, and/or friends/family that these individuals and families are able to stay afloat.”
Source
population by race (2019)
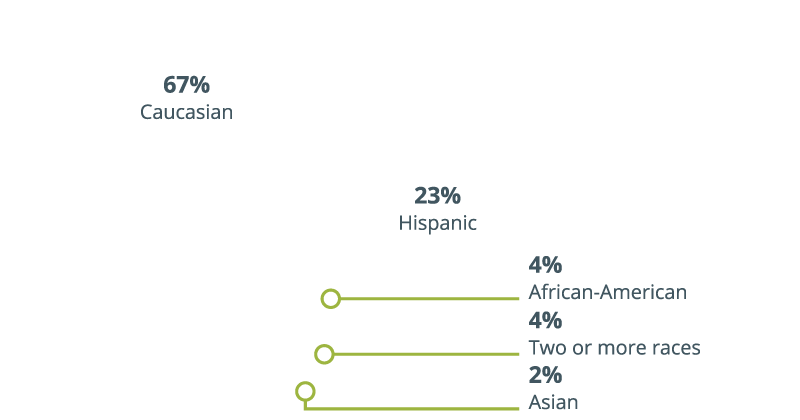
Source
Homes in Holland’s historic district
383

In a study conducted by the Historic District Commission, it was concluded that historic districts maintain higher property values even during times of economic downturn.
Source
Holland’s Urban Tree Canopy
24%
coverage of the city’s surfaces
$662,413
total value of pollution removal
Blog Article

Learn more about Ottawa County Parks here.
Parks
500 acres

We’re the city with 23 Parks! What can we say? We love our green spaces. We love to have places to play catch, play tennis, and have picnics. Our great parks are one more reason to love Holland, MI. Also, approximately 400 trees have been planted to help replace those that were lost due to Emerald Ash Borer disease.
Source
Windmill Island Gardens
Underwent several renovations, including the creation of a new biking and walking path.
Source
Lakeshore Ethnic Diversity Alliance
![]()
The Lakeshore Ethnic Diversity Alliance works to dismantle barriers to ensure people of all ethnic backgrounds have equal access and opportunity to participate fully in the life of the community. Influenced by national dialogue and research on racial equity, LEDA forms a bridge between formal and informal leaders and individuals throughout our community and region. This model establishes credibility, expertise, and accountability; increases visibility and awareness; and fosters defined, sustainable initiatives and outcomes.
Source
5/7
Quality of Life
Ultimately, it is the feelings and state of mind of individuals in the collective that make up a community’s quality of life. The community through governmental, religious, business and social organization, makes decisions and supports actions that contribute to the community’s well being.
Overall Population That Is Food Insecure in Ottawa County (2018)
Source: Feeding America’s Map the Meal Gap Report.
Arts & Culture
50 years
The Holland Area Arts Council improves access to the arts for the broader public by hosting outreach programs that offer arts experiences at festivals, schools, fairs and community events at little or no cost to participants.
Holland Area Arts Council
County Safety Data (2018)
3.6
Violent Crimes per thousand in 2018.
3.3 (2017); 3.4 (2016).
16
Property Crimes per thousand in 2018.
22 (2017); 27 (2016).
213
Traffic injuries or fatalities.
243 (2017).
Source
In cooperation with the Ottawa County Sheriff’s Office, the Holland Department of Public Safety now has available to residents an interactive criminal and incident mapping feature. Click here to view.
What we can do
- Incorporate healthy lifestyles into our culture, even though it may be a difficult thing to do.
- Spend more time educating children about healthier lifestyles.
- Help reduce the urge for people to want to eat fast and/or processed foods.
- Educate about the importance of physical activity.
- Provide information about healthy food options.
- Teach people how to cook healthy meals that do not require a lot of energy and time.
- Increase focus on nutrition and wellness, along with prevention methods.
- Determine ways to obtain affordable and healthy foods.
- View the Ottawa County Community Health Needs Assessment
Community Mental Health of Ottawa County Annual Report (2019)
![]()
6/7
Community Knowledge
The collective knowledge of the community is an incredible resource. The ability to tap into this wisdom is essential for continued growth. In both formal and informal channels, the community’s knowledge and energy must be channeled to where it is needed.
Ready for School – Basic Early Literacy Skills Indicator (2019)
70%
Up from 66% in 2018, 63% in 2016, 55% in 2010, and 43% in 2009.
Source
Education demographics of persons age 25 years+ (2018)
89%
High school graduate or higher.
32.1%
Bachelor’s degree or higher
Source
Sustainability Education at Hope College
Hope Education Programs

Step Up | TRIO Upward Bound | Explore Hope | Children’s After School Achievement (CASA)
Outdoor Education Programs
The Outdoor Discovery Center Macatawa Greenway (ODCMG)
In December, The Outdoor Discovery Center took over management of the DeGraaf Nature Center.
Source
Diversity Rocks the Books (2019 vs. 2018)
Since Diversity Rocks the Book first launched in 2018, we have distributed more than 600 picture books and middle grade novels to Holland schools, sent 45 guest readers from the community to make 60 classroom visits, and reached more than 1,500 students.
534 vs. 84
# of books delivered.
38 vs. 22
# of schools visited.
26 vs. 19
# of guest readers.
852 vs. 705
# of students reached.
Source
7/7
Environmental Awareness & Action
The natural and built environments interact with one another over time with intended and unintended consequences. Educating the public on environmental protection and integrating these ideas into our city planning can change negative outcomes of the past and improve our future state.
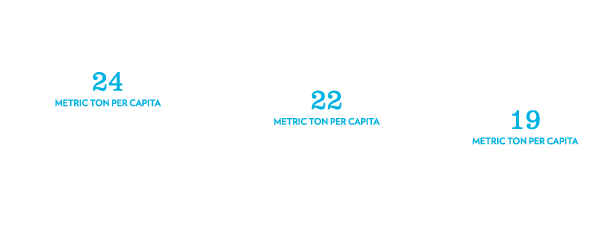
Decrease in metric tons of emissions per capita over the last five years
Source
# of households who reduce GHG profile from baseline
During our 2010 baseline GHG assessment, our CO2e was calculated as 24 metric tons (mt) per capita. Our 40-year Community Energy Plan goal is to reduce that number to 10 mt CO2e per capita by 2050.
Want to know more? Visit: EPA’s “My Environment” for Zip Code 49423
Holland brings home Outstanding Achievement Award for Environmental Efforts at America in Bloom Symposium
Learn about Holland’s Daily Air Quality Reporting here and here.
Waste Characterization (2018)
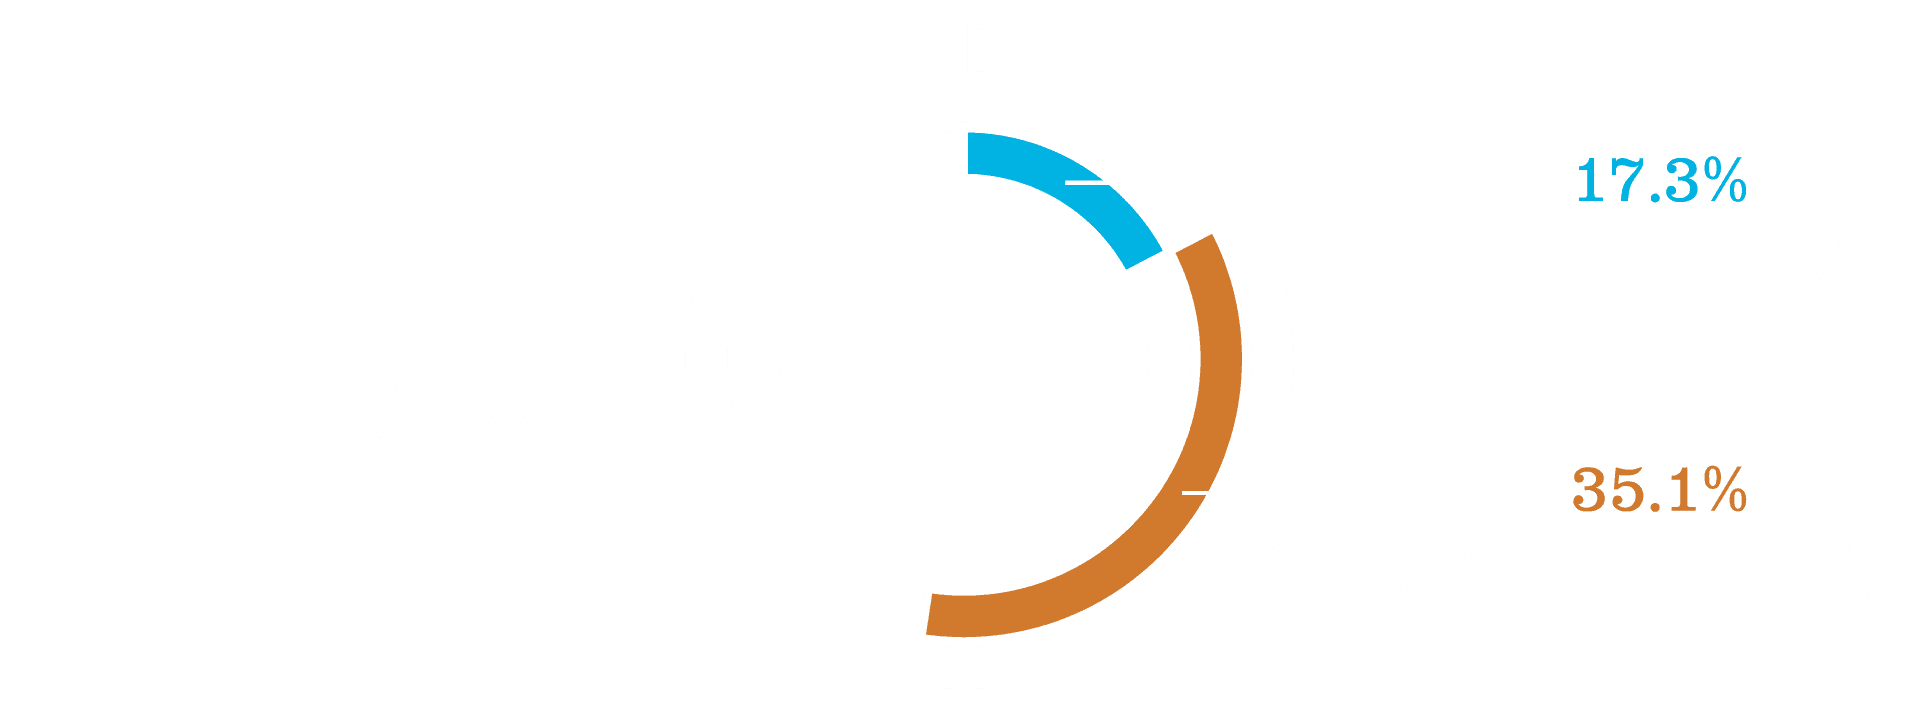
Source
Average Stream Quality Scores (Fall 2012- Spring 2019)
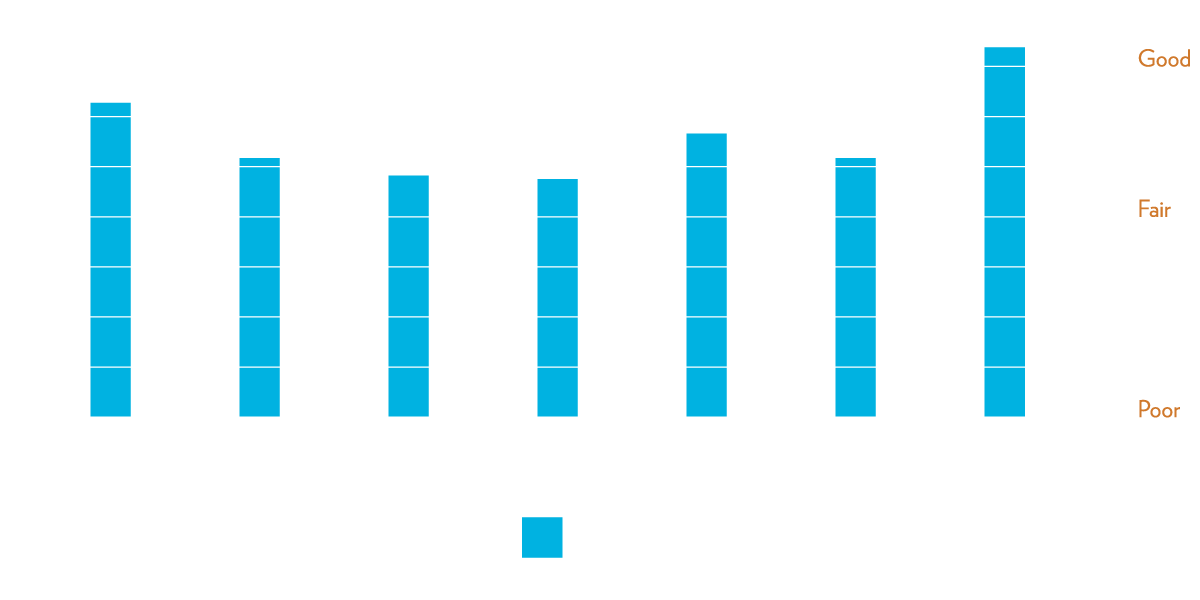
Source
water surface total phosphorus concentration (2019)
Source: Project Clarity — The goal of Project Clarity is to restore the water quality of Lake Macatawa and the Macatawa Watershed. The multi-phased approach provides solutions focused on land restoration, Best Management Practices (BMPs), community education, and long term sustainability.
Click here for updated graphs.
Holland-Hope College Urban Tree Canopy Research Project

Trees surveyed and 171 different tree species identified. Project inventoried most trees on Hope’s campus, Windmill Island, and public property.
Source
A new TreeSAP app has been developed in partnership with Hope College (Biology and Computer Science Department), Holland-Hope College Sustainability Institute, City of Holland, and Holland in Bloom. Download it here.
Macatawa Area Coordinating Council Annual Report (2019)
Outreach and Education
- 12 community events and 4 community presentations
- 2019 Water Festival held on July 13 at Windmill Island
- 150 volunteers helped pick up trash, inventory road-stream crossings and stencil storm drains
Stormwater Management
- Updated development rules to protect surface water quality
- Conducted employee training about preventing pollution from municipal activities
- 2019 Making the Case for Green Infrastructure Seminar held on August 15
Agricultural Program
- 4,000 acres of cover crops planted
- 5,000 feet of grassed waterway installed
- Received new grant from the Great Lakes Commission to continue this work
The complete 2019 Annual Report can be found here.
Water Usage (CCF)
Wastewater (CCF)